Demo: Linear Prediction Filters
(Revised September 8, 2006)
The purpose of this demonstration is to compare the performance of the two most important Linear Prediction filters, set according to the Hybrid LP Filters dialog and tested using the Correlation Test - Filters dialog. It will be shown that both of the filters tested show good positive correlation with future returns, on a variety of settings of the time horizon of 10, 20, and 40 days. The performance on the 1-day setting is not so good, which supports our hypothesis that on short time scales the correlation is masked by stochastic noise. The longer time horizons average out much of this stochastic noise, leaving a well-defined signal and measurable correlation. (So much for the Random Walk theory!) As a bonus, it can also be seen that there is often very significant correlation between past returns and future returns, in the present cases mostly negative correlation, indicating a return to the mean mechanism.
To perform these tests, first select the Hybrid LP Filter dialog box, in the Greeting dialog or Main Window. This can be selected directly from the Greeting dialog when QuanTek first opens. Then select a stock to test using the Stock Data button. Then select a filter to test using the Filter Type button. (The filter type and settings that initially appear are those which have already been saved in this particular security data file. You can also set and save the filter type and parameters for each security data file in this dialog.) The preferred settings of the Order of Approximation and Fractal Dimension are automatically set with each Filter Type, but you can also change these manually. When you select the Correlation button, the set of 1024 price projections is calculated, from which the correlation is then calculated. The result is then displayed in the the Correlation Test - Filters dialog. This is the dialog shown in the displays below.
The two main Linear Prediction filters used in QuanTek, the Toeplitz DWT filter and the Toeplitz FFT filter, make use of the fractional difference parameter (fractal dimension) of a fractionally differenced (FD) process. The fractal dimension is estimated from the Wavelet (DWT) spectrum, and set automatically for each filter to the measured value. You can also change this setting manually if desired. At the present time, many stocks can be observed to have a negative fractal dimension, indicating trend anti-persistence or a return to the mean mechanism. So the assumption that every process exhibits trend persistence, with a positive fractal dimension, is not strictly true. It is very important to accurately be able to measure the sign of the fractal dimension, and set the filter accordingly. Otherwise if the sign of the Fractal Dimension is wrong, what you will get is negative correlation in the Correlation Test - Filters test. In what follows, we will compare the performance of the DWT and FFT filters for the cases of MSFT stock, with a measured fractal dimension of -0.06, XOM stock, with a measured fractal dimension of -0.16, and AAPL stock, with a measured fractal dimension of about +0.01. The first two, MSFT and XOM, have a fractal dimension which is substantially negative, while AAPL has a fractal dimension which is barely positive.
Toeplitz DWT Linear Prediction Filter -- MSFT
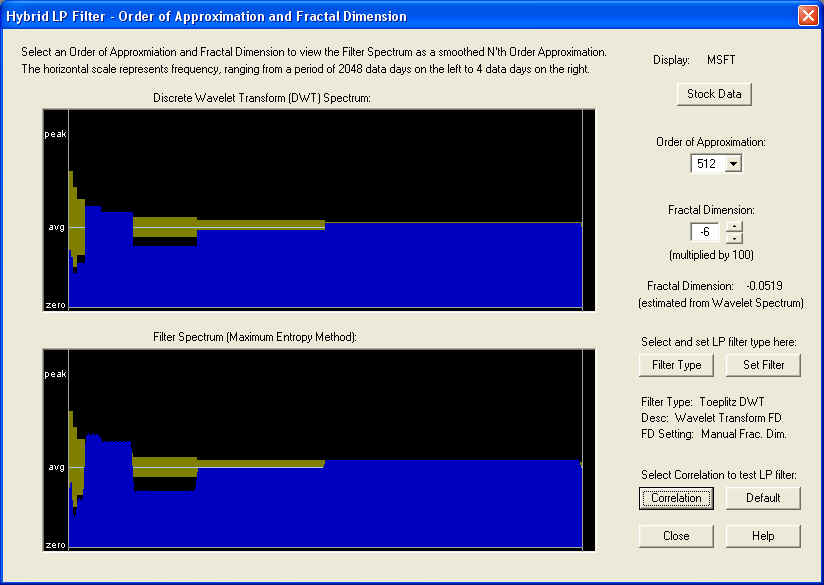
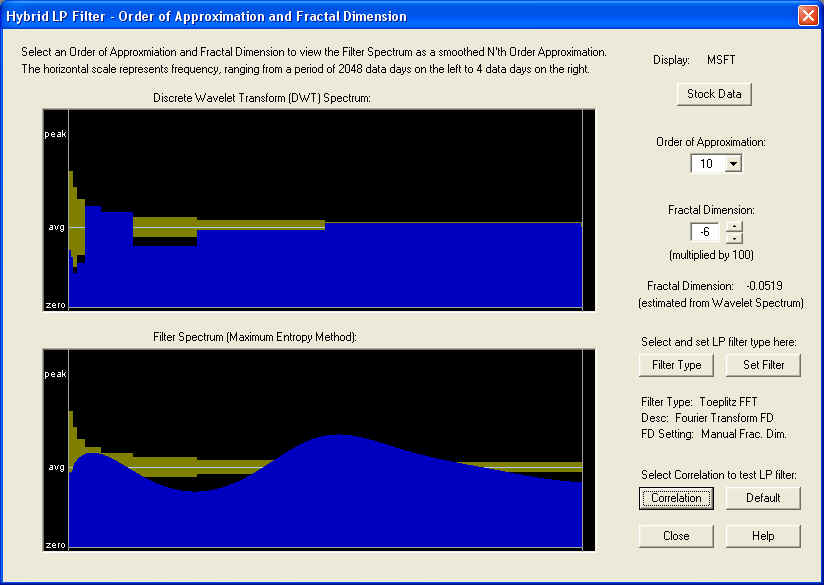
We now examine the case of MSFT stock. The default Linear Prediction filter is the Toeplitz DWT filter, based on the Discrete Wavelet Transform (Wavelet spectrum). This filter also makes use of a fractional difference parameter (fractal dimension), which in this case is computed from the Wavelet spectrum to be about -0.06. The Hybrid LP Filter dialog shows the DWT spectrum of the MSFT stock and the corresponding filter spectrum, which in this case are nearly identical, since the Order of Approximation by Chebyshev polynomials is on the highest setting (512) possible, and should nearly reproduce the spectrum, which is 1024 units in length. (Note that only the lower half of the spectrum is shown.) The result is:
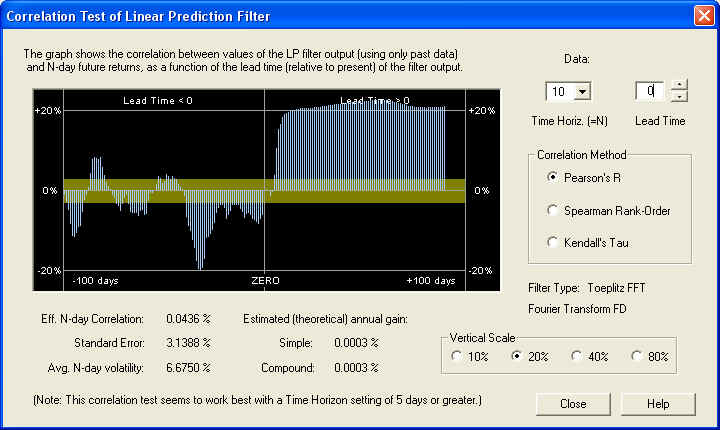
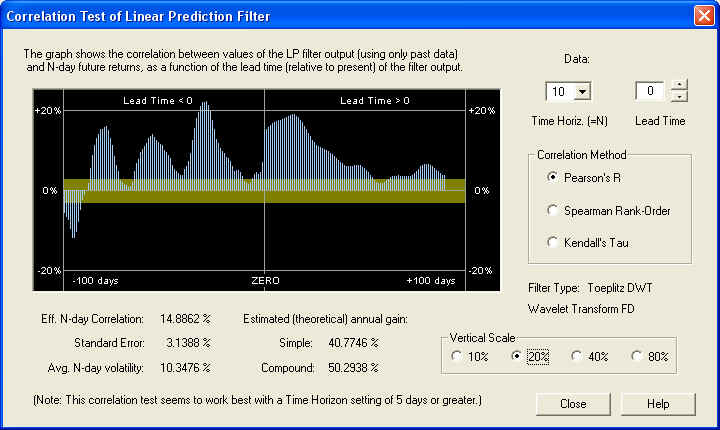
We first examine the correlation on the 10-day time horizon. This means the correlation between the 10-day average of the past returns together with future Price Projection (returns), and the 10-day average of the future returns, is computed. To the left of the ZERO line are the past returns, while on and to the right of ZERO are the future Price Projection (returns):
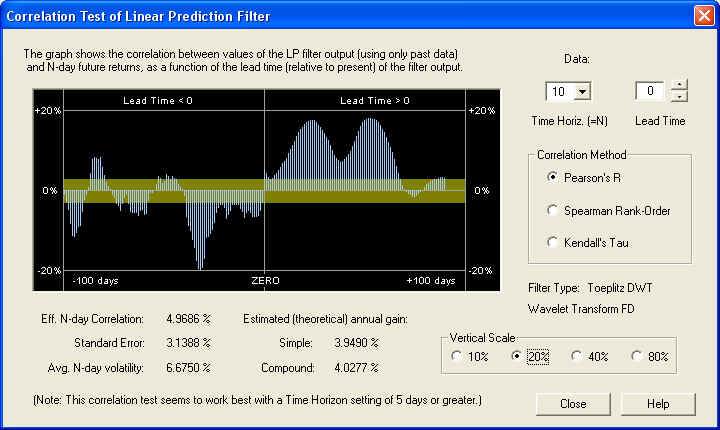
On the 10-day time horizon, the correlation peaks occur further out on the Price Projection, not underneath the ZERO line as would be expected. It should be noted that to the future of the ZERO line, the filter transitions from an FIR filter to an IIR filter, since it has a type of "feedback" mechanism in the Price Projection past day 1. However, there are two (for some reason) substantial positive correlation peaks out to the future on the Price Projection. The first one is 24 days out:
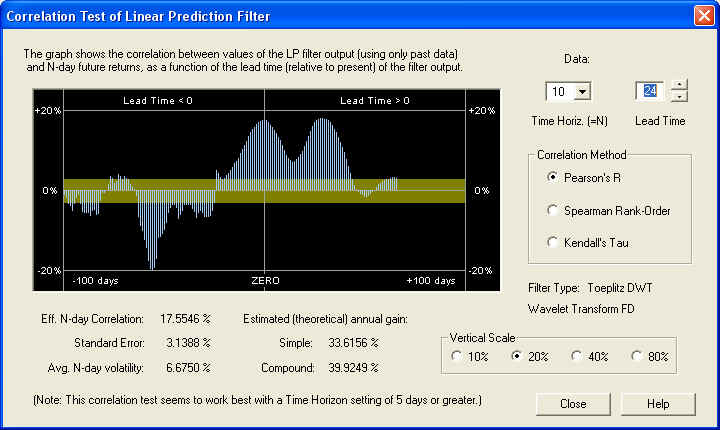
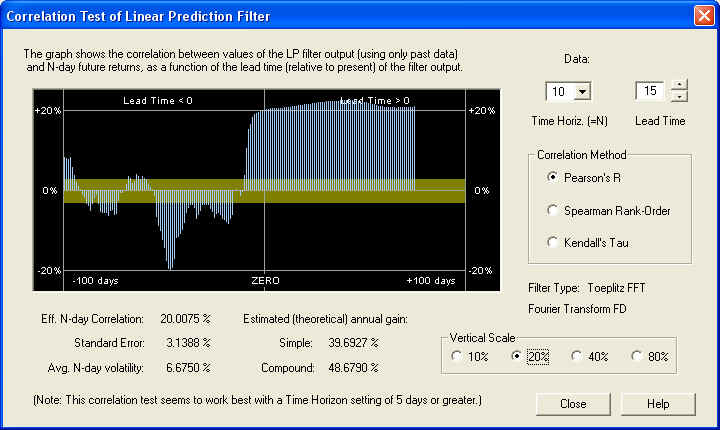
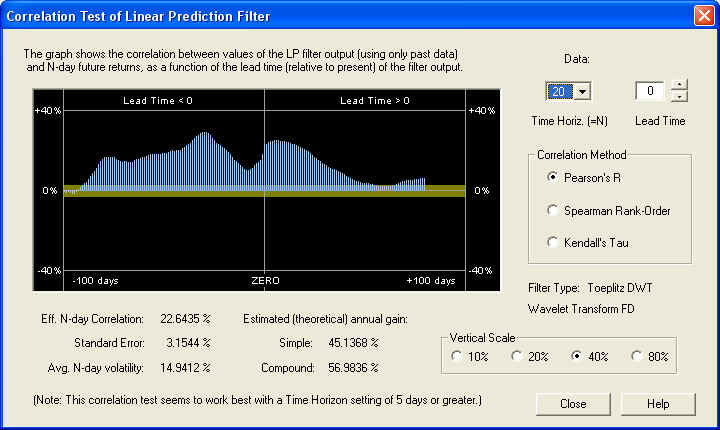
This is a very healthy 17.5% correlation with the future returns, averaged over the first 10 days. Note that the standard error is 3.14%, so this correlation peak is significant to 5.6 standard deviations. Here is the same graph on the 20-day time horizon:
This is more like what we would expect, indicating that on the 20 day time horizon, more of the stochastic noise has been filtered out, leading to a consistent positive correlation with the future returns over the first 20 days in the future. The correlation peak is at the ZERO line, and is far outside the one-standard-error band, indicating that it is many standard deviations away (5.94) from a random correlation. Also notice the substantial negative correlation in the past. This reaches a (negative) peak at 32 days in the past:
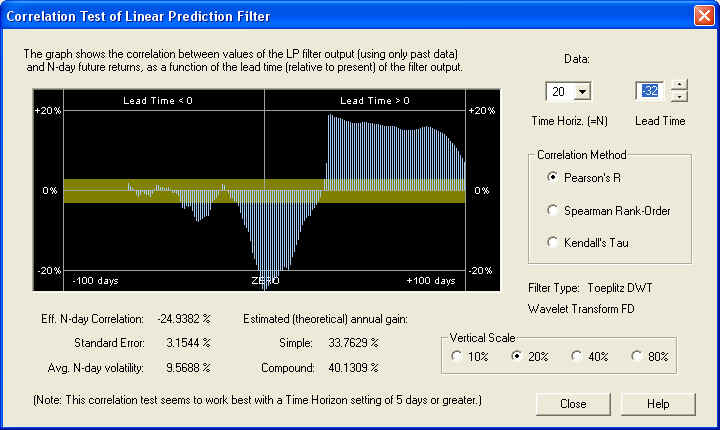
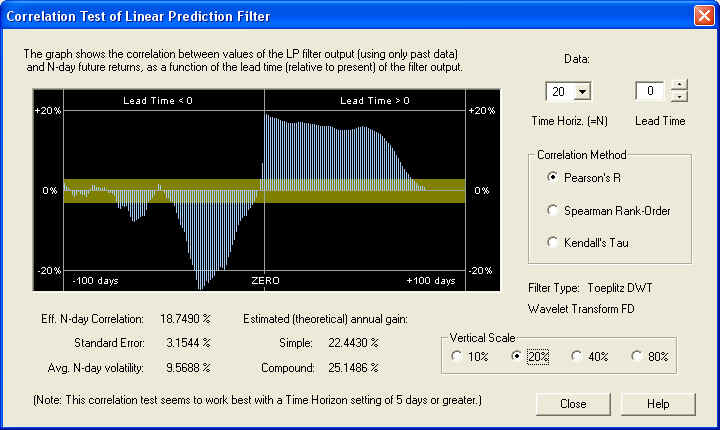
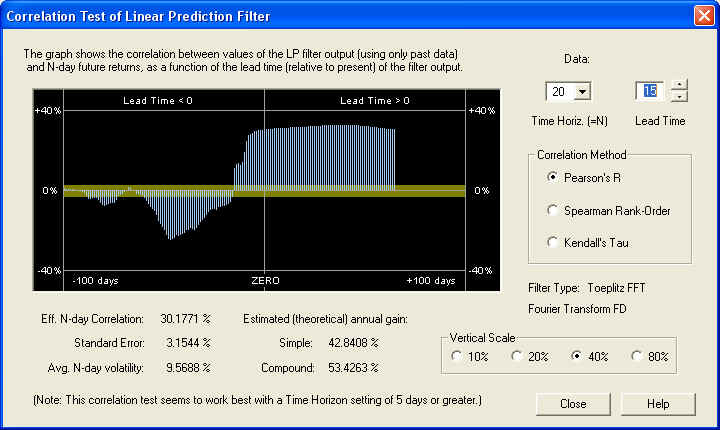
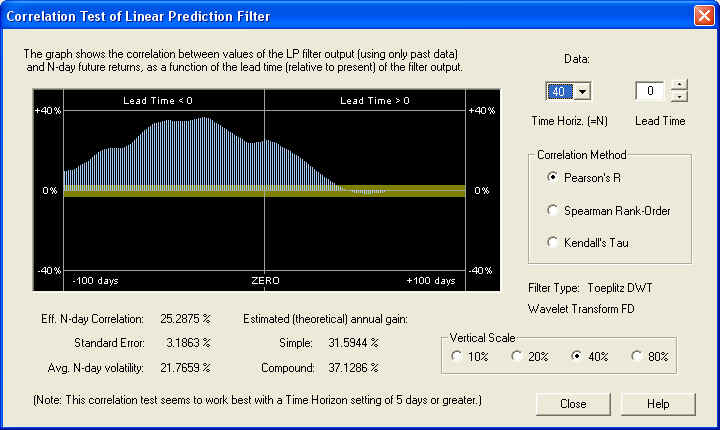
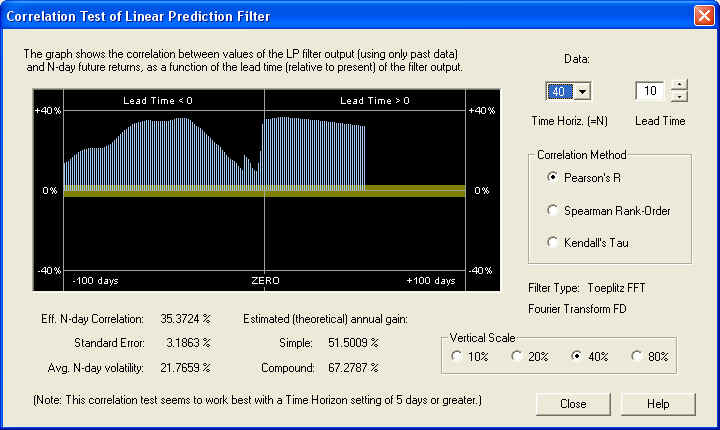
So on the 20 day time horizon, there is a nearly 25% correlation between the past returns, 32 to 12 days in the past, with the future returns, from 1 to 20 days in the future. This excellent negative correlation could be used as the basis for an effective technical indicator. Let us now check the 40-day time horizon:
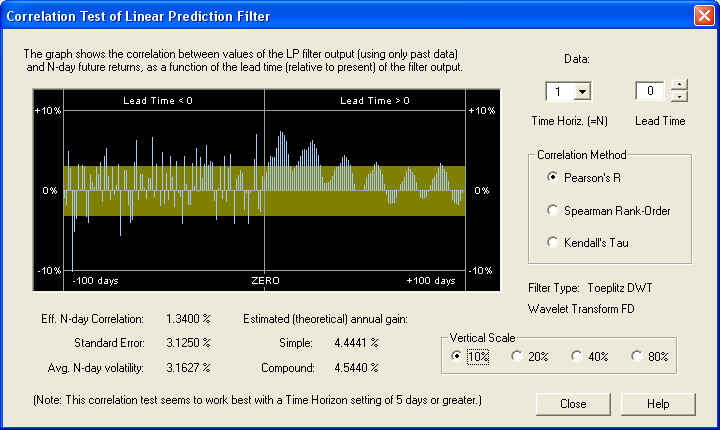
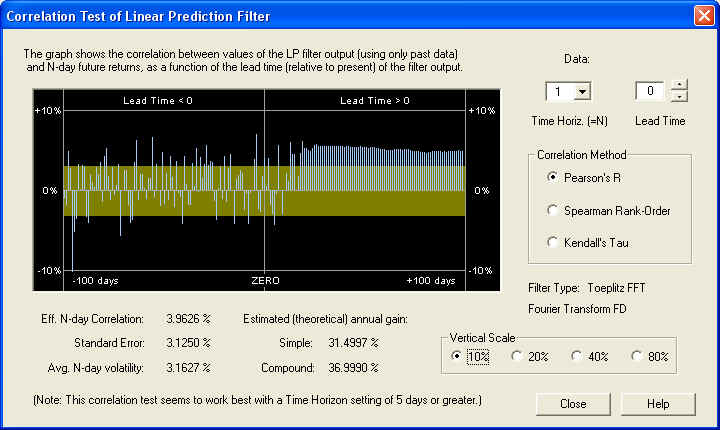
The results are also consistent on this time scale, and show a very nice correlation at ZERO time lag, as we would expect. Finally, we check the 1-day time horizon:
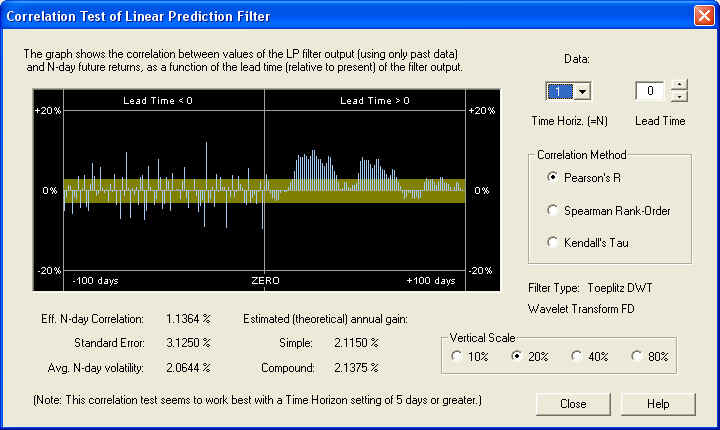
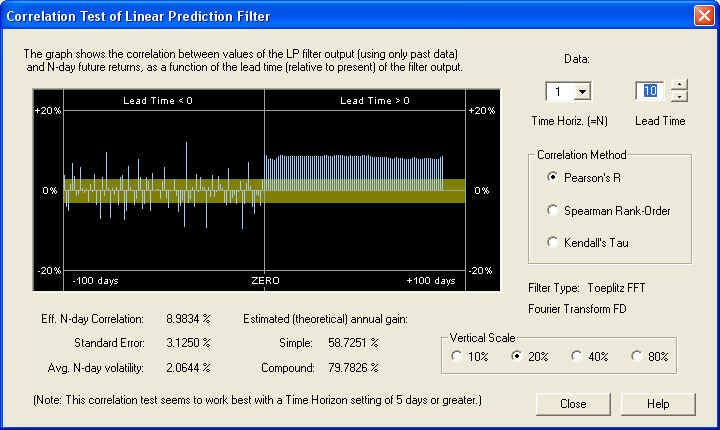
On the 1-day time horizon, we see very little positive correlation, except further out on the Price Projection. This indicates that the longer-term correlation is being masked by short-term stochastic noise. On the other hand, we notice a rather strong anti-correlation between the return for day 0 (the last day of the past data) and the 1-day future return (the negative bar just to the left of the ZERO line). Utilizing this simple rule of anti-correlation between one day's returns and the next day's returns could lead to very significant gains, estimated here to be almost 89% compound annual gain:
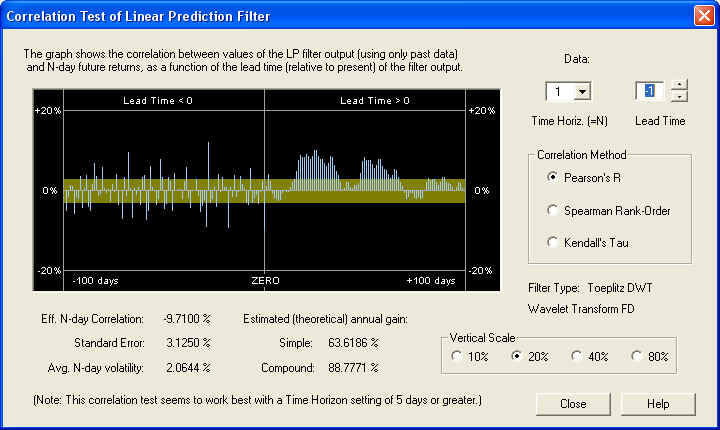
Note, however, that the correlation to the past of the ZERO line appears more or less random, so this isolated one-day correlation could be partly or completely a random fluctuation. The most reliable correlations are those that show up as broad peaks extending over a time interval of many days.
Toeplitz FFT Linear Prediction Filter -- MSFT
We now test the filter based on the Fast Fourier Transform (FFT), utilizing the FFT spectrum. In this case, we want to use a low Order of Approximation to try to smooth out the stochastic noise from the FFT spectrum. The resulting filter spectrum is to be compared with the DWT spectrum. They don't look exactly alike, but the most important thing is to reproduce the peak or valley at the very low end of the spectrum. This is accomplished for a low Order of Approximation by correctly setting the Fractal Dimension. In the present case, this is set according to the estimated value from the Wavelet Spectrum:
The result of the Correlation Test - Filters test for a 10-day time horizon is as follows:
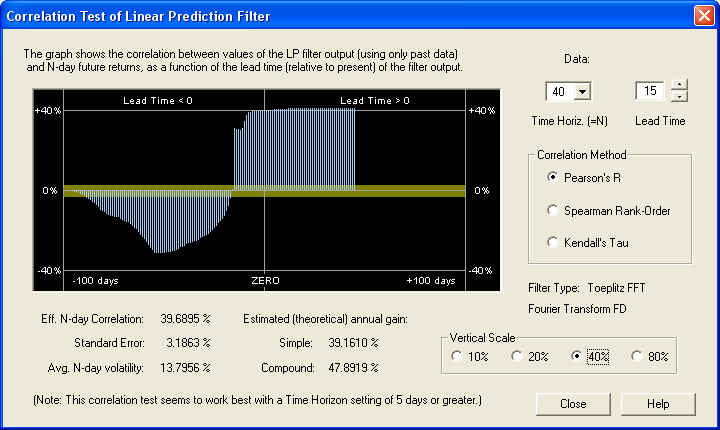
This display shows a very nice positive correlation of the filter output with future returns, but the correlation does not start until about 10 days out on the future Price Projection. Since the length of the AutoRegressive (AR) part of the filter is 10 days, as set by the Order of Approximation setting, we suspect that the AR part of the filter, on this time horizon, is ineffective, and only the longer-term fractional difference filter, corresponding to the Fractal Dimension setting, is effective in this case. Measuring the correlation at a Lead Time of 15 days in the future yields the following:
So we find a very nice positive correlation of greater than 20%, leading to a compound annual return (theoretical) of over 48%. Now let us take a look at the same graph on the 20-day time horizon. (Note the change of vertical scale.)
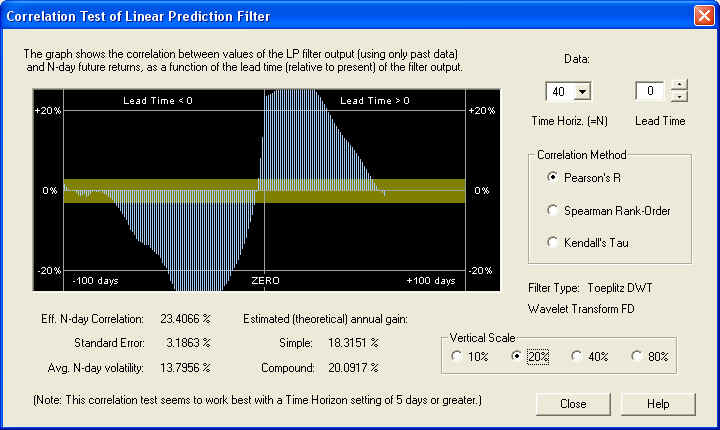
On this time scale, we start to see positive correlation at the ZERO mark, but it is still greater 15 days out into the future. At any rate, we can feel confident that the long-term estimate of future returns from from the Price Projection will be an accurate one. Also note the large negative correlation between the past returns and the future returns. This could also be used as the basis for an effective technical indicator. Here is the same graph on the 40-day time horizon:
This is an outstanding correlation with future returns on the 40-day scale, due mainly to the correct setting of the Fractal Dimension. But note also the same correlation peak in the past data as before, at a lead time of -32 days. So for most values of the time horizon, especially the 40-day, the past returns delayed by 32 days in the past are negatively correlated with the future returns. This anti-correlation between past returns and future returns is characteristic of a return to the mean mechanism. Finally, on the 1-day time horizon, we still see good correlation with future 1-day returns, starting 10 days out in the future:
However, the correlation seems to start 10 days in the future, not at the ZERO mark. This must be related to the setting of the Order of Approximation control at 10, which also leads to an effective length of the series of LP coefficients of 10 days. As stated before, evidently the AR part of the filter, consisting of the first 10 LP coefficients, is ineffective, and only the fractional difference part of the filter is effective. This in turn depends on the correct setting of the Fractal Dimension parameter. The above graphs shows that the Price Projection, starting at 10 days out in the future, is well correlated with the 1-day future returns. So this could again be used as the basis of an effective technical indicator.
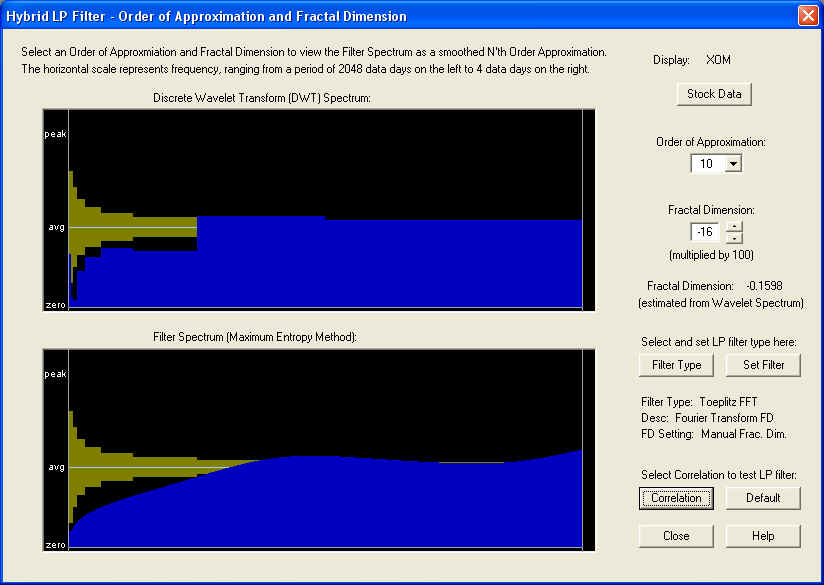
Toeplitz DWT Linear Prediction Filter -- XOM
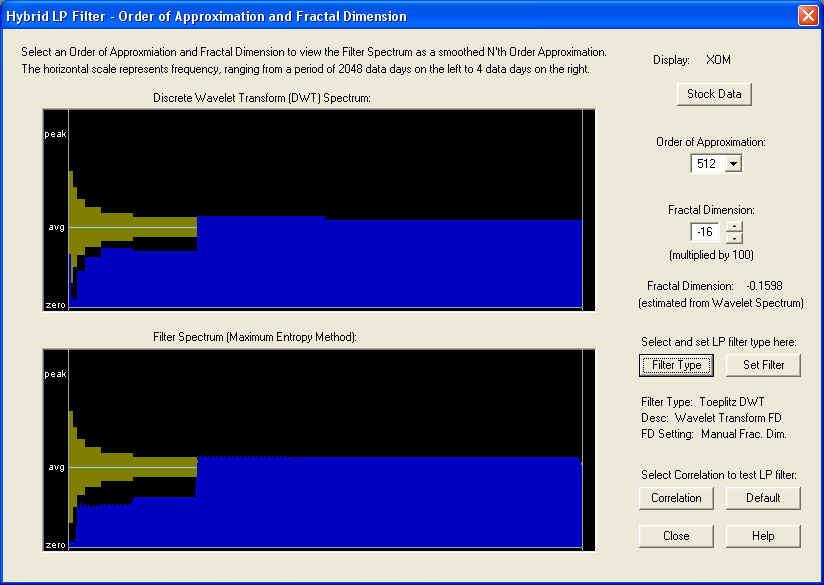
Here we test the performance of the Toeplitz DWT Linear Prediction filter on stock XOM. This stock is a good one to study because it has a very pronounced negative Fractal Dimension, as can be seen in the DWT spectrum from the Hybrid LP Filter dialog, shown here. Please notice how the spectrum diminishes to zero at the low frequency end. In the dialog, the estimated Fractal Dimension is about -0.16, and this is the default value set into the Fractal Dimension control:
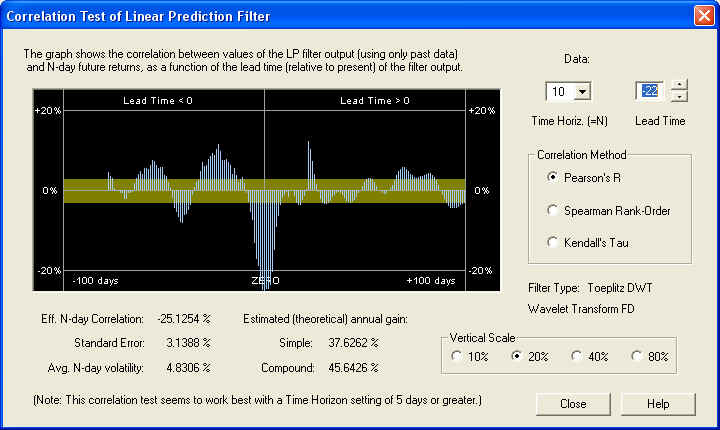
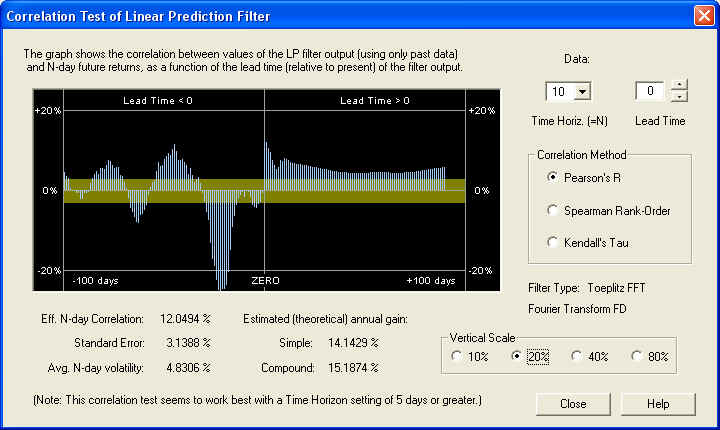
The Correlation Test - Filters is now computed by clicking the Correlation button, and the result is displayed in the Correlation Test - Filters dialog, for the 10-day time horizon:
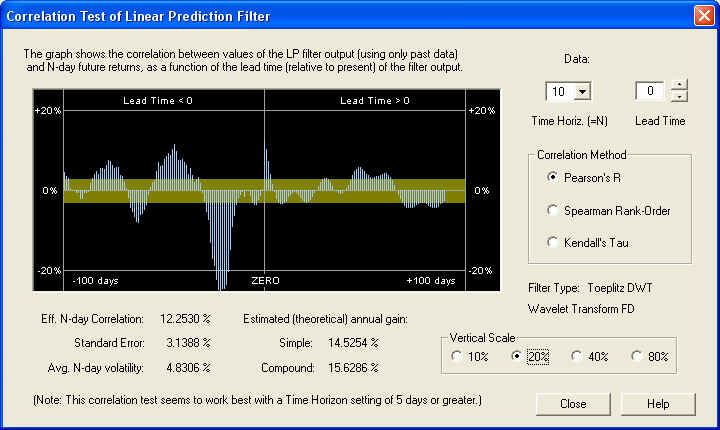
Notice the nice correlation peak under the ZERO line. The measured value of the correlation between the Price Projection (returns) and the future returns is 12.2530%, which is about 4 standard errors. The estimated returns due to this correlation are not too bad, considering that this is a very large, mature company. However, notice that there is a very large negative correlation peak between the past returns and the future returns, independent of the Linear Prediction filter. Adjusting the Lead Time control to bring this under the ZERO line, we see that it is 22 days in the past (one month), and shows an amazing correlation of -25.1254%. If the past returns, averaged over 10 days, from 22 days ago were used directly as a (negative) technical indicator, then this should theoretically lead to a compound annual return of 45%!
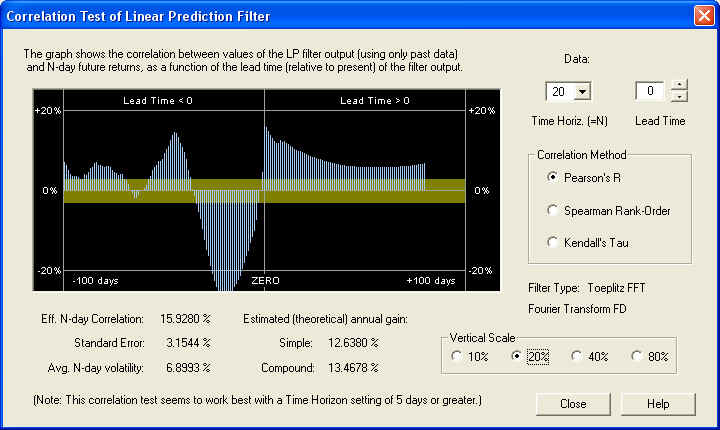
Returning to the filter output, on the 20-day time horizon, we find a similar result to the previous one. There is a very nice positive peak right on the ZERO line, showing that the DWT filter is doing its job. Beyond about 10 days into the future, however, the result appears random, in that it is within the error bar most of the time:
Similarly, on the 40-day time horizon, we find:
The filter performance seems to improve at the longer values of time horizon. However, on the longer time horizon the estimated annual gain decreases, of course, because the N-day volatility increases more slowly with N than N itself. By contrast, on the 1-day time horizon, we find that the correlation, although still visible, is barely above the 1 standard error level, so it is being masked by stochastic noise:
Nevertheless, the Toeplitz DWT filter gives consistently good performance, showing that the Discrete Wavelet Transform, time averaged over each octave, is effective in eliminating a substantial portion of the stochastic noise.
Toeplitz FFT Linear Prediction Filter -- XOM
For the Toeplitz FFT filter, based on the Fast Fourier Transform, we use the following settings in the Hybrid LP Filter dialog. Notice the smoothed filter spectrum, which is an approximation to the measured DWT spectrum of the stock returns:
On the 10-day time horizon we find a nice correlation peak under the ZERO line. Apparently in this case the AR part of the filter is effective:
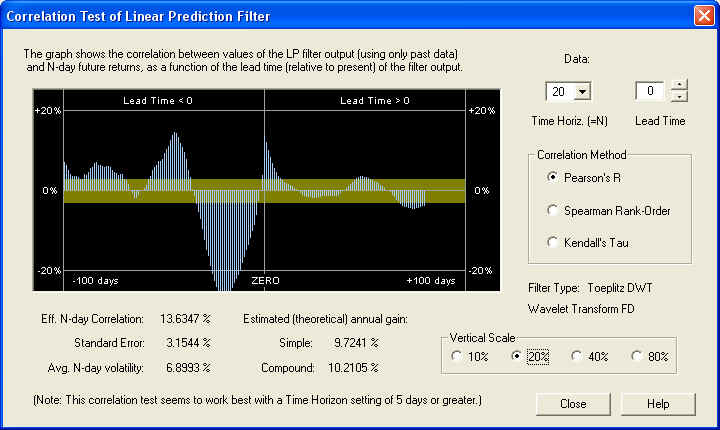
At the 20-day time horizon, the positive correlation peak is even more pronounced, under the ZERO line as it should be. Also note the same significant negative correlation peak in the past returns:
So very good results can be obtained with this filter, on the 20-day time horizon. The results in this case for the 40-day time horizon are not so good, however. This probably has a lot to do with the large negative correlation peak at -32 days, indicating once again anti-persistence and a return to the mean mechanism. Thus it is important to choose the right time horizon for trading, which might be somewhat different for each security. It will also change, of course, as market conditions change. In a trending market exhibiting persistence of returns, for example, the correlation peak between the past returns and the future returns should be positive.
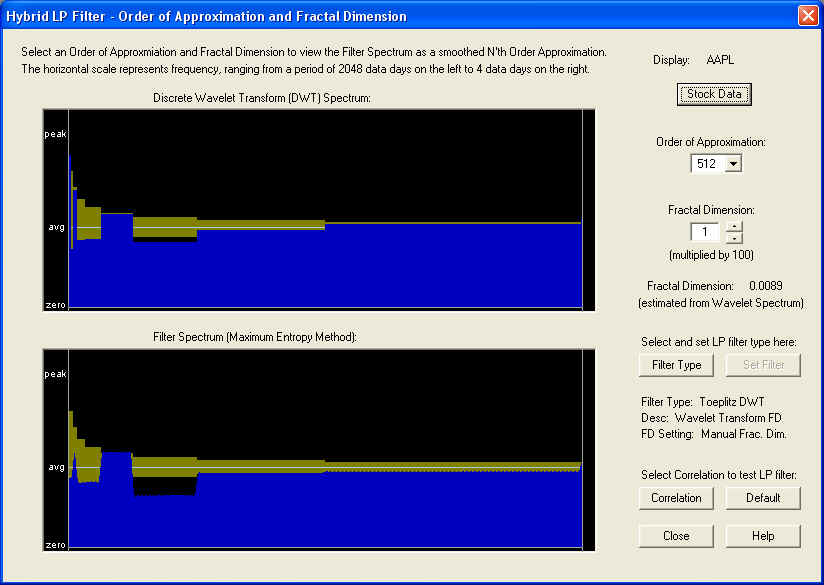
Toeplitz DWT Linear Prediction Filter -- AAPL
Let us now try the Toeplitz DWT filter, based on the Discrete Wavelet Transform (Wavelet spectrum), using AAPL stock. This filter also makes use of a fixed fractional difference parameter (fractal dimension), which in this case is computed from the Wavelet spectrum to be about +0.01. This is very slightly positive, and is indicated in the DWT spectrum by the two small spikes at the very lowest frequencies. But these turn out to be important for the predictive properties of the filter:
Starting with the 10-day time horizon, we find:
This filter shows an excellent positive correlation between the output of the Price Projection (returns) and the future returns, on a 10-day time horizon. The correlation starts right under the ZERO line as it should. However, the correlation about 10 to 15 days out, with the 10-day future returns, is even better. We also see some significant positive correlation peaks between the past returns and the future returns. This should be contrasted with the previous examples, which had negative fractal dimension and negative correlation between past and future returns. Here is the same graph on the 20-day time horizon (note the change of vertical scale):
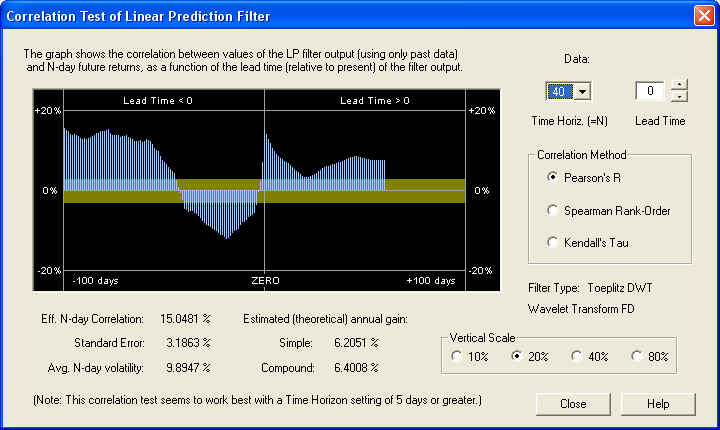
This time horizon gives an even better result than the 10-day, as judged by the estimated annual gain. Again, the correlation is many standard errors away from a random result. If the correlation were random, it should be within the yellow band 68.3% of the time, which it clearly is not. Let us also examine the 40-day time horizon:
Again, the result is an excellent positive correlation at all values of lead time, many standard errors away from a random correlation. The correlation between the past returns and future returns is even better than that due to the Price Projection. So, a valid technical indicator could be based on the past returns, independently of any Price Projection. For comparison, let us examine the 1-day time horizon:
This DWT filter gives a decent result even on the 1-day time scale, although further out on the Price Projection. In general, though, as before, the correlation is being masked by short-term stochastic noise.
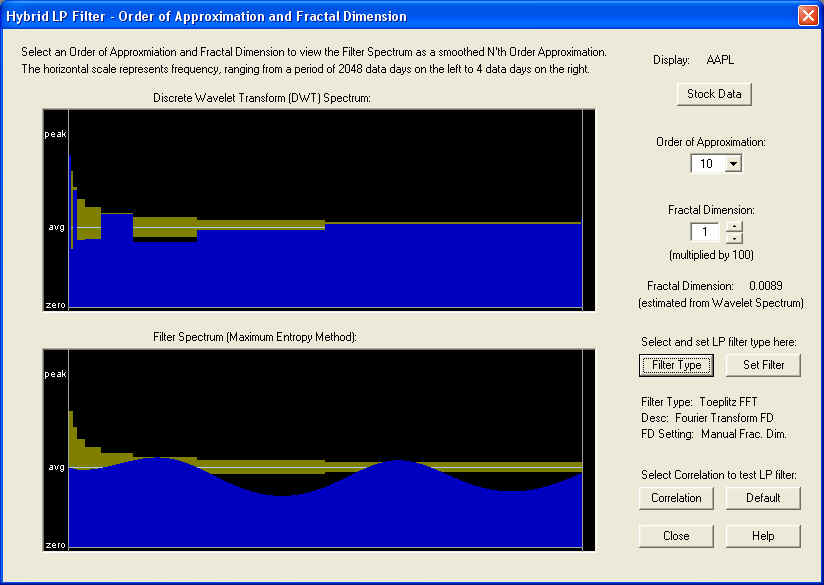
Toeplitz FFT Linear Prediction Filter -- AAPL
Here are the settings for AAPL stock when the Toeplitz FFT filter is chosen. Note again the Order of Approximation setting of 10 days, which serves to smooth out the FFT spectrum. The resulting spectrum, with the tiny positive Fractal Dimension value set, is shown here:
The result of the Correlation Test - Filters for a 10-day time horizon is as follows, in which the Lead Time has been set ahead 15 days. Once again, it appears that the AR part of the filter, out to about 10 days in the future, is ineffective, and only the fractional difference filter is effective, corresponding to the tiny Fractal Dimension:
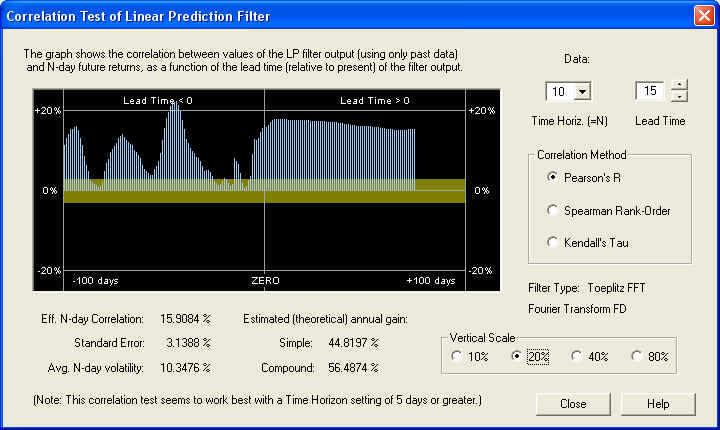
This shows that for the 10-day time horizon, the Price Projection has a healthy positive correlation with future returns, starting about 10 days out in the future. Also there is a nice peak to the past of ZERO, which is centered under the ZERO line when the lead time is set to -30 days:
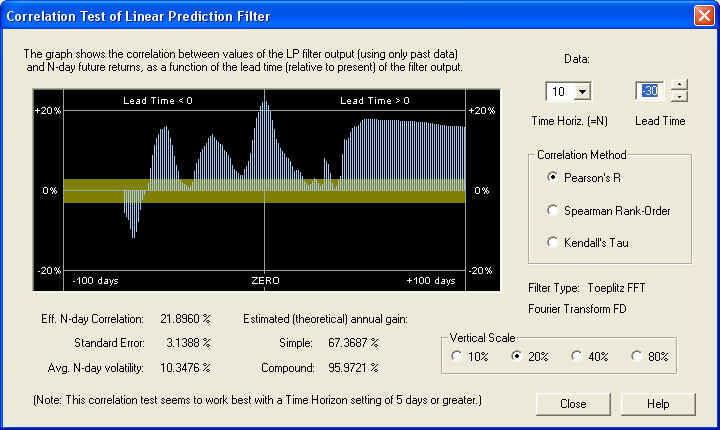
This correlation peak has nothing to do with the future Price Projection. It is a positive correlation, on the 10-day time horizon, between the past returns 30 days in the past (for the next 10 days) and the future returns (starting at day 1 in the future and extending for 10 days). This correlation peak could be used as the basis of a set of trading rules, without relying at all on the accuracy of the Price Projection. Here is the same display, except that the time horizon has been set for 20 days and the lead time is set for 10 days:
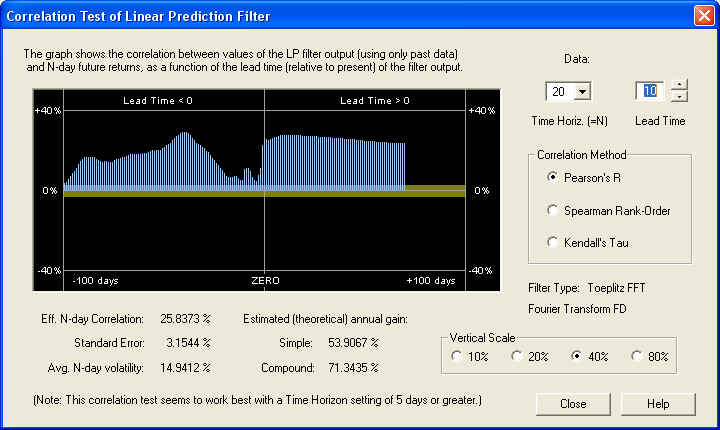
Now we can see that there is a nice positive correlation all across the graph. It should be pointed out that the yellow band represents the one standard error bar, so if this correlation were random, it should be within the yellow band 68.3% of the time. Clearly, the correlation is many standard errors away from randomness in this display, on the 20-day time scale. Here is the same display, except that the time horizon has been set for 40 days and the lead time is set for 10 days:
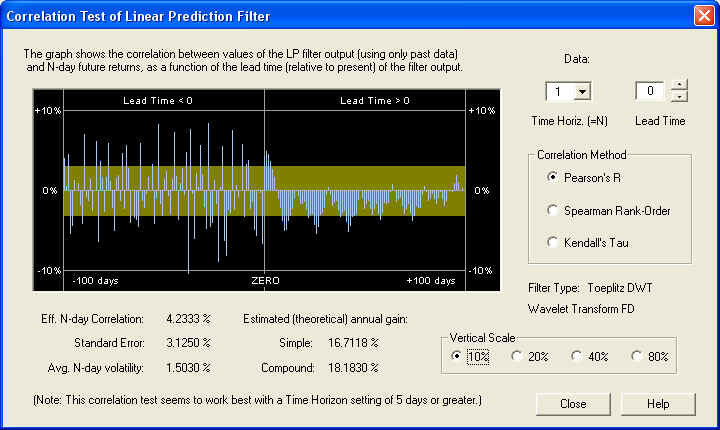
This shows an even more consistent positive correlation, although the estimated returns are a little lower on this time scale. So the conclusion is that after the high-frequency noise is filtered out, there is significant correlation present in the low-frequency components between past and future returns. Finally, let us take a look at the result on a time scale of 1 day, with a lead time of 0 days:
On this short time horizon, the correlation does look very much random in the past, and up to about 10 days in the future, after which it starts looking consistently positive. However, this positive correlation is only about 1.5 standard errors, so it is being masked by stochastic noise. So the secret to finding correlation in stock returns is to filter out the high-frequency stochastic noise and measure the correlation between the low-frequency components of the spectrum.
Conclusion
Both the DWT and the FFT Linear Prediction filters gave consistent correlation with future returns in the Correlation Test - Filters test, at least for values of the time horizon of 10 days or greater. In fact, the performance of the DWT filter appeared to be consistently better than that of the FFT filter. The results for the 1-day time horizon were less clear for the filters. It would appear that the flat Price Projection from the DWT filter is a more realistic projection, and the short-term detail in the Price Projection from the FFT filter (for high approximation orders) may be mostly stochastic noise, so that it is the long-term projection of the return that is of most importance.
The default Toeplitz DWT filter gave good results in all three examples tested. In this default filter, the Order of Approximation is set to the highest setting of 512 days, and the Fractal Dimension setting is zero. However, on the highest setting of Order of Approximation, the Fractal Dimension has almost no effect, because the filter spectrum is almost identical to the DWT spectrum of the returns. So the fractal dimension is captured in the DWT spectrum itself. In the case of the Toeplitz FFT filter, on the other hand, the default settings were 10 days for the Order of Approximation, in order to smooth out the jagged appearance of the raw FFT spectrum. With this setting, the correct setting of the Fractal Dimension becomes important. This correct setting may be judged from the measured fractal dimension from the DWT spectrum, and from the appearance of the low-frequency end of the DWT spectrum itself. If you guess wrong and get the wrong sign for the Fractal Dimension, you will know it immediately because the filter output will have a negative correlation with future returns.
return to Demonstrations page