Omicron Research Institute
QuanTek Econometric & Technical Analysis Software
QuanTek Indicator Windows
In addition to the Main Graph, the current version of QuanTek comes with a set of three Splitter Windows which are called the Indicator Windows. These three windows are called Indicators (low-pass smoothing), Indicators (band-pass smoothing), and Adaptive Filter Output. Each Indicator window has three splitter panes, displaying three separate indicators. The most important indicators are shown in the bottom panes of each window. These are the Relative Price (low-pass), Relative Price (band-pass), and Projected Future Returns. These three indicators are the source of the Buy/Sell Signals, Buy/Sell Points, and Long/Short Signals. These Indicator windows and their associated indicators are described below.
The first two Indicator windows each show three different indicators, which are called Relative Price, Velocity, and Volatility. The Relative Price indicator is constructed from prices with wavelet smoothing on two different time scales. The shorter time scale is the Time Horizon (N) which is set in the Trading & Portfolio Parameters dialog. In fact, this setting determines the smoothing time scale for all displays and filters in the program. The longer time scale corresponds to the highest wavelet levels and is of the order of 1028 days. All the displays are causal, meaning that at any point it time, they are constructed only from past data relative to that point. Each data point of the indicator is a separate smoothing over the past data relative to that point. So the Relative Price indicator consists of the difference of the causal wavelet smoothing of the price on the short and long time scales. In this way, the Relative Price indicator is analogous to the usual Moving Average Convergence-Divergence (MACD) indicator of ordinary Technical Analysis. The other two indicators are the Velocity, which is just the N-day smoothed returns, and the Volatility, which is just the N-day smoothed average absolute deviation of returns. These three smoothed indicators are also the regressors used in the Adaptive Filter calculation.
The indicators are also smoothed usiing two different methods, low-pass and band-pass, illustrated below. The low-pass smoothing means that the wavelet levels shorter than a certain time scale are cut off and only the levels for longer time scales are kept. The band-pass smoothing means that only wavelet levels in a small range corresponding to a certain time scale are kept and both longer and shorter time scales are cut off. Hence the low-pass smoothing contains the very low-frequency signals, while the band-pass smoothing does not.
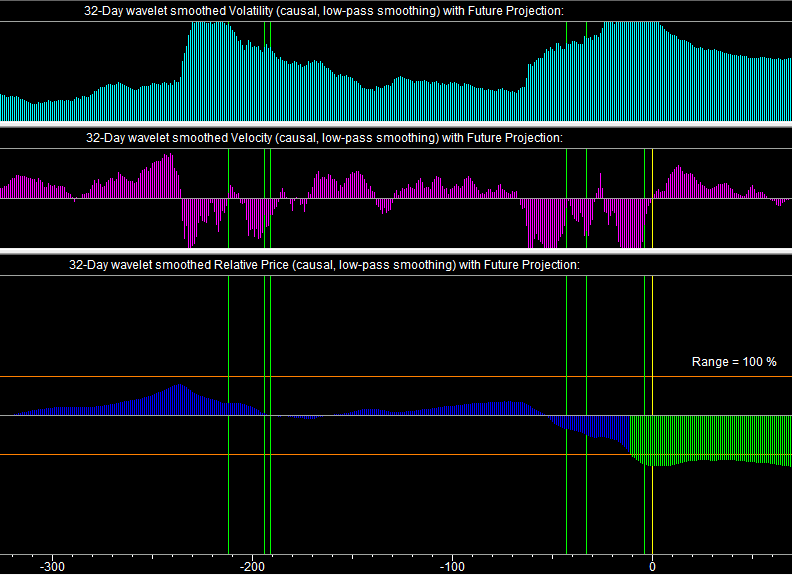
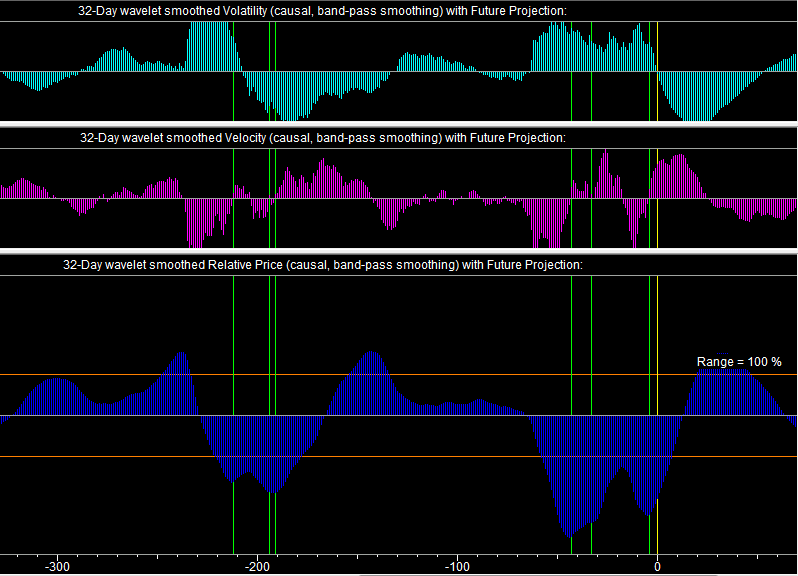
In the displays below, the yellow vertical line denotes the present time. The time scale at the bottom denotes days in the past (negative) and future (positive). The indicator for future days is obtained from the past indicator by means of linear prediction using the Standard LP Filter. The green/red vertical lines mark the positions of the Buy/Sell Points, which are inflection points of the Relative Price (band-pass) indicator (see the Indicators (band-pass) graph). The horizongal orange lines are the settings of the Range and Threshold which are set in the Trading & Portfolio Parameters dialog. These determine the levels at which the Buy/Sell Signals and Buy/Sell Points (Range), and Long/Short Signals (Threshold) are triggered.
Indicators (low-pass smoothing)
The Indicators (low-pass smoothing) window is shown here for Standard & Poors 500 (.SPX):

The Relative Price indicator with low-pass smoothing is shown in the bottom pane. The low-pass smoothing retains the low-frequency components of the indicators. Thus this Relative Price indicator can be interpreted as an oversold/overbought ndicator, which I call the Buy/Sell Signals. These indicate optimal Buy/Sell price levels due to the oversold/overbought condition of the market. For example, the S & P 500 did not show much activity up to a few weeks ago on the Relative Price indicator, indicating that it was staying close to its long-term trend and was not in an oversold/overbought condition. But then about a month ago it underwent a sell-off and selling climax, and as a result the oversold condition is indicated by the green region, giving rise to Buy Signals. The regions where these signals are triggered can be adjusted by varying the Range control. Also the Adaptive Filter Output must be positive/negative for the Buy/Sell Signals to be triggered. These Buy/Sell Signals are shown as green/red rectangles on the graphs on Scale 8.
The Velocity indicator is just the smoothed returns, in this case with low-pass smoothing. The returns do not have many low-frequency components, so there is not too much difference between the low-pass and band-pass display for the Velocity. The Volatility display is the average absolute value of returns, so this display is always positive. It is still positive using low-pass smoothing, so in this display it is shown relative to the zero point at the bottom of the graph. No indicators are derived from the Velocity or Volatility.
The Relative Price may be thought of as corresponding to the return to the mean correlation. The Velocity may be thought of as corresponding to the trend persistence correlation, and the Volatility corresponds to GARCH. In the Adaptive Filter calculation, all wavelet levels of these indicators are used as regressors.
Indicators (band-pass smoothing)
The Indicators (band-pass smoothing) window is shown here for Standard & Poors 500 (.SPX):

The Relative Price indicator with band-pass smoothing is shown in the bottom pane. The band-pass smoothing cuts off the low-frequency components of the indicators. Thus this Relative Price indicator can be interpreted as an oscillator type of indicator, which I call the Buy/Sell Points. These indicate possible Buy/Sell points for short-term trading or swing trading. In this example, the S & P 500 is showing short-term fluctuations even though it is remaining close to its long-term trend. The Buy/Sell Points are triggered when there is an N-day inflection point in the Relative Price. The regions where these points are triggered can be adjusted by varying the Range control. Also the Adaptive Filter Output must be positive/negative for the Buy/Sell Points to be triggered. These Buy/Sell Points are shown as green/red arrows on the graphs on Scales 4 and 2, and as green/red vertical lines on all the Indicator windows.
The Velocity indicator is just the smoothed returns, in this case with band-pass smoothing. The returns do not have many low-frequency components, so there is not too much difference between the low-pass and band-pass display for the Velocity. The Volatility display is the average absolute value of returns, so this indicator is always positive. The display is positive or negative using band-pass smoothing, however, so in this display it is shown relative to the zero point at the center of the graph. No indicators are derived from the Velocity or Volatility.
The Relative Price may be thought of as corresponding to the return to the mean correlation. The Velocity may be thought of as corresponding to the trend persistence correlation, and the Volatility corresponds to GARCH. In the Adaptive Filter calculation, all wavelet levels of these indicators are used as regressors.
Adaptive Filter Output
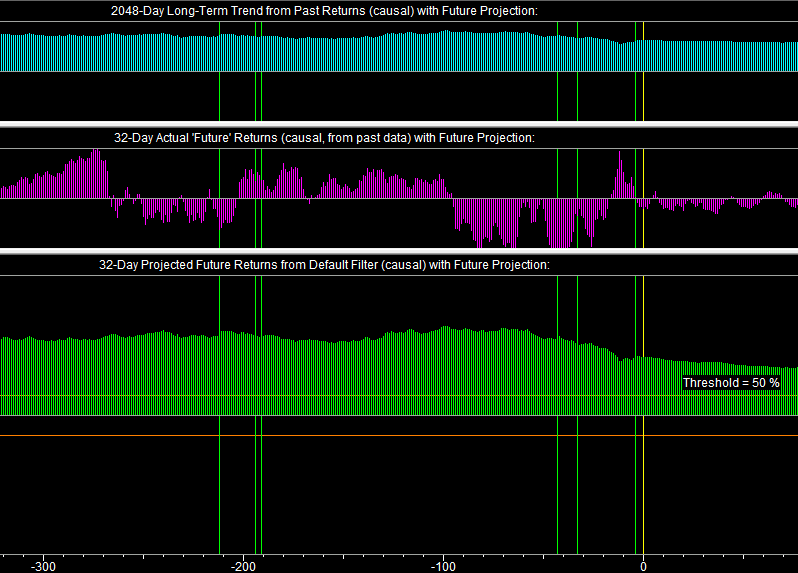
The Adaptive Filter Output window is shown here for Standard & Poors 500 (.SPX):

The bottom pane shows the actual output of the Adaptive Filter, which is the N-day projected return at each day in the past. (In this case, N=32 days.) This means that the filter was calculated with a Time Horizon setting of N=32 days, which has been set in the Trading & Portfolio Parameters dialog. The filter parameters have been set so that the filter gives the nice, smooth output shown above. This means that the filter is responding mainly to the long-term trend and not to short-term anomalies, such as the recent sell-off and selling climax. Nevertheless, it can be seen that the projected return has decreased a little bit over the past month, due to this. The output of the Adaptive Filter is an indicator that I have named the Long/Short Indicator. This is because if the projected return is positive/negative, the recommended position is long/short. The Long/Short Signals are triggered by the projected return being outside the Threshold, which has been set in the Trading & Portfolio Parameters dialog. If this is the case, it is shown in green/red; otherwise if it is inside the horizontal orange lines, it is shown in blue.
The Actual 'Future' Returns pane in the middle shows just that -- at each point in the past the actual N-day 'future' returns relative to that point in the past. (Of course, these 'future' returns are made up of past data.) These are the actual N-day returns that the Adaptive Filter is trained on as it steps one day at a time into the future and the filter coefficients are adjusted to fit this data. In the filter computation, these N-day 'future' returns are extended by the N-day linear trend when within N days of the present. Then this display is extended by Linear Prediction into future days, as are all the indicators. So this is the graph that the Adaptive Filter output should reproduce if the data were perfectly correlated, which of course it is not.
The top pane shows the 2048-day Long-Term Trend, or in other words, the slope of the 2048-day (robust) trend-line, extended into the future to make an alternative Price Projection. As can be seen, the slope of this long-term trend-line is not constant, although it changes slowly. The Adaptive Filter output actually reproduces this long-term trend-line more closely than the N-day 'future' returns that it is trying to emulate. This is because the Adaptive Filter is a low-pass filter and it responds mainly to the low-frequency components of the signal, which are the ones that contain most of the correlation. This is a good thing, because it eliminates excessively erratic trading and hence greatly reduces the risk. Most of the reward comes from taking advantage of the overbought/oversold conditions, which are slowly changing in general. This 2048-day Long-Term Trend is what is used to estimate N-day expected return in the Optimal Portfolio, and the risk is just the 2048-day average volatility. So (in this version of QuanTek) the Adaptive Filter is not even used to compute the Optimal Portfolio.
Go back to QuanTek Features